How it Started:
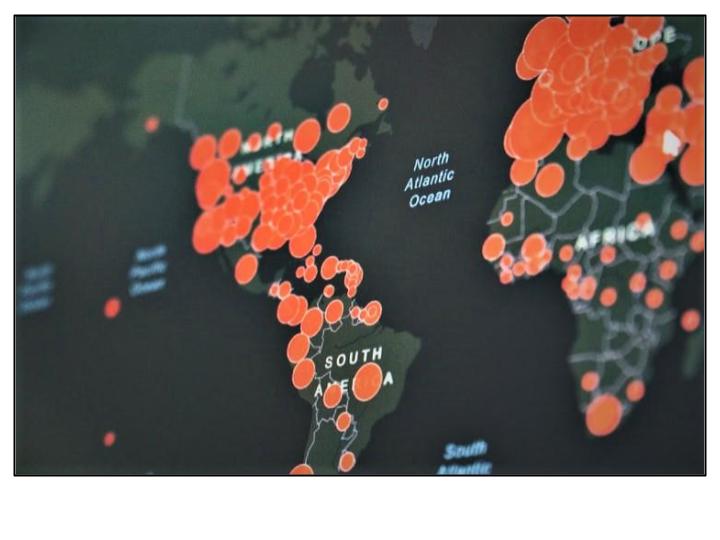
Here at Futurety, we have learned that data can help improve everything because it allows for an inside look at consumer needs, resource use and so much more. During the pandemic, we found that our skills in data were extremely well fitted to helping track the spread of the virus, resource needs, case rate by demographics, geographic regions and income.
We upgraded our IT security and insurance policies to handle more sensitive information and soon were winning new public health contracts. Towards the end of the pandemic, our applied skills in data were used to help track vaccine rollout, availability, and understanding who specifically was getting vaccinated in relation to their geographic location and specific demographic background.
What we did was a very small part of this fight, but it also felt good to be using our skills and resources in the battle against COVID. At Futurety, while we are a business first, at heart we always try and accomplish meaningful work that can make a difference and positively impact others when we can.
How it’s Going:
We have excelled at working with public health data and the team finds the work gratifying. We continue to win in this space and are focusing here, even in a post-pandemic world because, as we have learned, there will always be a need for data in future public health projects around the world.
Going forward, aggregating, analyzing, and visualizing public health data will remain one of our core capabilities and we are excited to continue applying our skills to new areas and projects.

