Do you want to know how to make your data more manageable, gain valuable business insights from the data you have, or communicate your data in new ways?
At Futurety, we believe data is power. Deriving insights from data drives smarter marketing, product development, and business strategy. Data visualization allows you to see a crystal clear picture of what your customers are currently doing and how you can influence what they do next.
We’ve gathered a handful of definitions and thorough articles to empower and increase your understanding of data visualization.
What is Data Visualization?
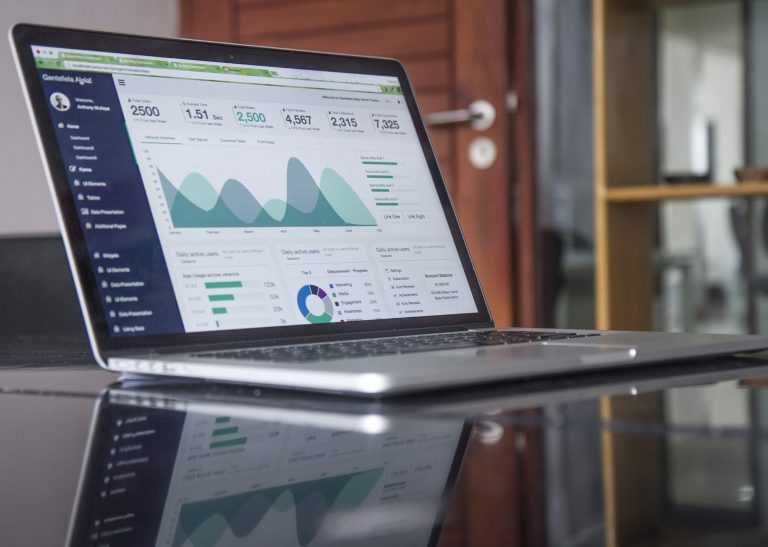
Data visualization software simplifies complex data and translates it into a story that anyone can understand and share. Futurety uses a variety of tools to process data and convert it into easy-to-understand images.
- Resource 1: Data Visualization: Software Turns Masses of Data into Story
- Resource 2: Comparing Data Visualization Software: Here Are The 7 Best Tools For 2018
How Do We Use It?
Once data visualizations are created, data-driven insights can then be shared with key decision makers to inform organizational, business, and marketing strategies.
- Resource 1: Closing The Gap Between Data Analysis And Decision Makers
- Resource 2: Data Visualization: A Bridge Connecting Data Scientists and Business Leaders
How Does Data Visualization Fit Into My Industry?
Finally, data visualization can be used in a wide variety of contexts and industries from retail, finance, healthcare, and beyond.
- Resource 1: HIMSS Big Data and Healthcare Analytics Forum: What to Expect
- Resource 2: 7 Predictions for the Future of Business Analytics
At Futurety, we believe these processes and applications should be accessible to business leaders and industry innovators alike. Now, share your insights with new audiences!