From Data Chaos to Actionable Insights
From integrating data sources to customizing visualizations that make trends impossible to miss, we turn complex information into clear, actionable stories. So whether you’re tracking campaign performance or operational efficiency, our dashboards are built to help you see what’s next and act on it with confidence.
Data Storytelling
Our team analyzes and identifies data trends and insights to create cohesive visualizations that tell a clear story
KPI & Goal Representation
We collaborate with stakeholders to understand specific goals, while tailoring visualizations to measure key metrics and progress
Visualization & Design
We create visually appealing and interactive dashboards that are easy to understand and navigate
Utilizing elements such as filters, segmenting, and drill-downs to support data exploration
Transparent Reporting & Insights
Our detailed reports offer clear insights into your businesses performance, helping you track ROI and understand the impact of your data.

Case Study
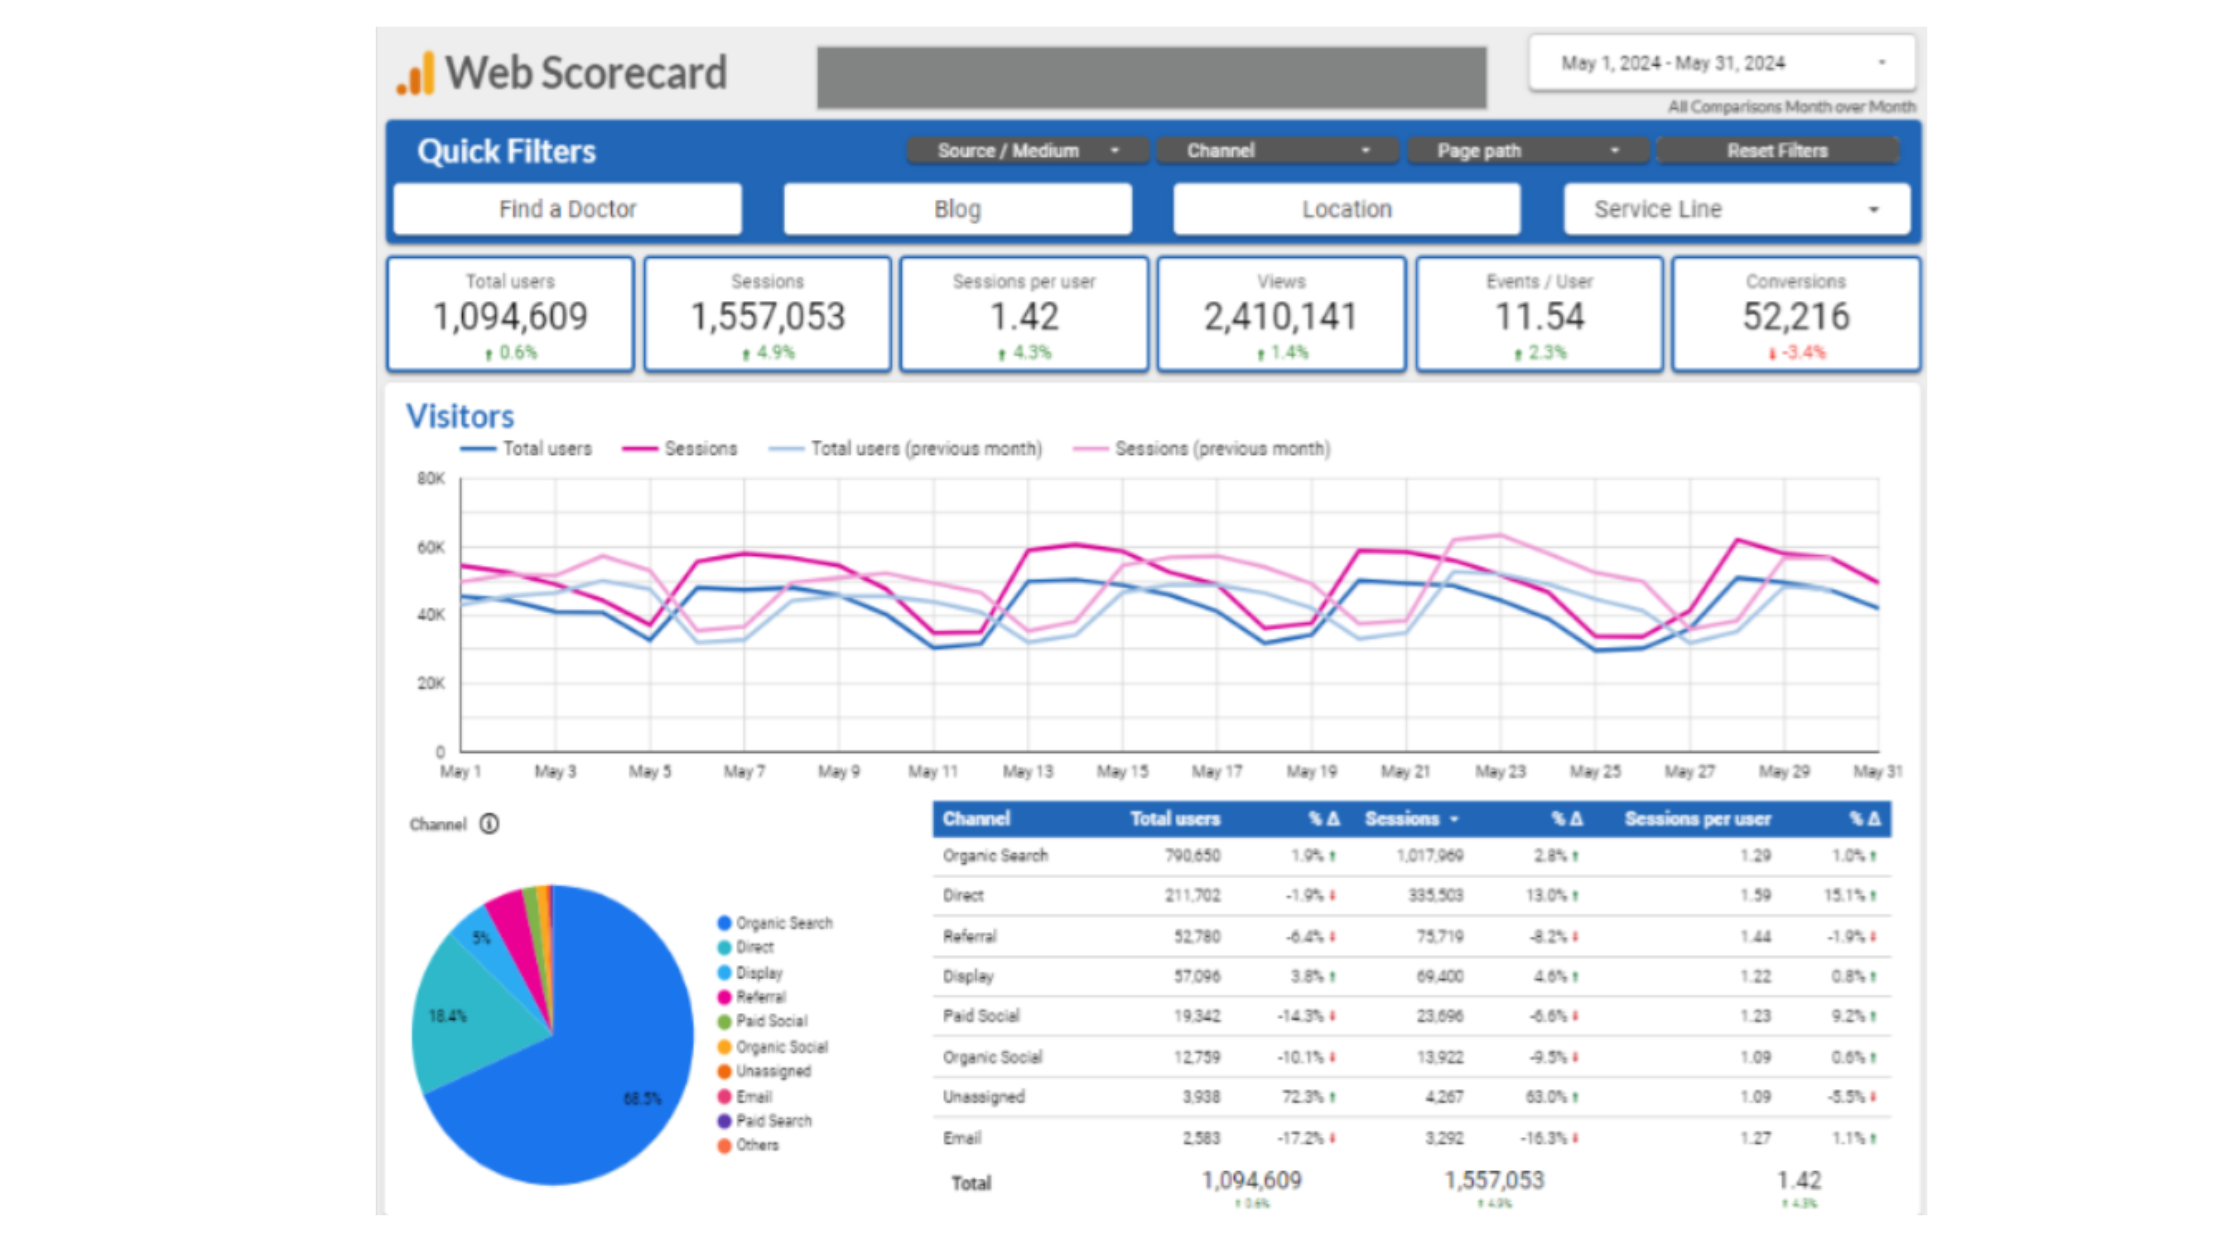
How a Midwest Health System Transformed Patient and Web Data into Action
The Client is an integrated, not-for-profit healthcare organization in the Midwest. The health system operates over 40+ medical centers and 250+ locations, including acute care hospitals, destination facilities for complex cancer and orthopedics and sports medicine care, behavioral health facilities, and numerous primary and urgent care centers.
The Client’s marketing team came to us with a complex set of needs regarding data engineering and data visualization. The Futurety team worked to create web scorecards to visualize service line and location performance over time integrating various sources, including GA4, MyChart, call tracking, and other healthcare platforms.
Ready to Visualize Your Data?
Whether you’re a startup or an established brand, we’re here to help you grow.
Frequently Asked Questions
What types of data can be connected to a dashboard?
We can connect nearly any data source—CRM platforms, website analytics (like GA4), EHR systems (like MyChart), marketing tools, spreadsheets, and more. If your data exists, chances are we can integrate it into a single, easy-to-understand dashboard.
How customizable are the dashboards?
Our dashboards are fully tailored to your needs. You choose the KPIs, design preferences, filters, and layout. Whether you want a high-level executive overview or detailed, drill-down views for specific teams, we’ll build it to fit your goals.
Do I need technical expertise to use the dashboard?
Not at all. Our dashboards are designed to be intuitive and user-friendly. We also provide onboarding and training so your team can confidently explore and act on the insights—no coding or data science background required.
How often is the data updated?
We can set up dashboards to update in real-time or at custom intervals—hourly, daily, weekly—based on your needs and data sources. That way, you’re always working with the most current and accurate information.